Mail queue monitor
To open Mail queue monitor navigate to Cog → System → Mail queue monitor (sidebar, Mail section)
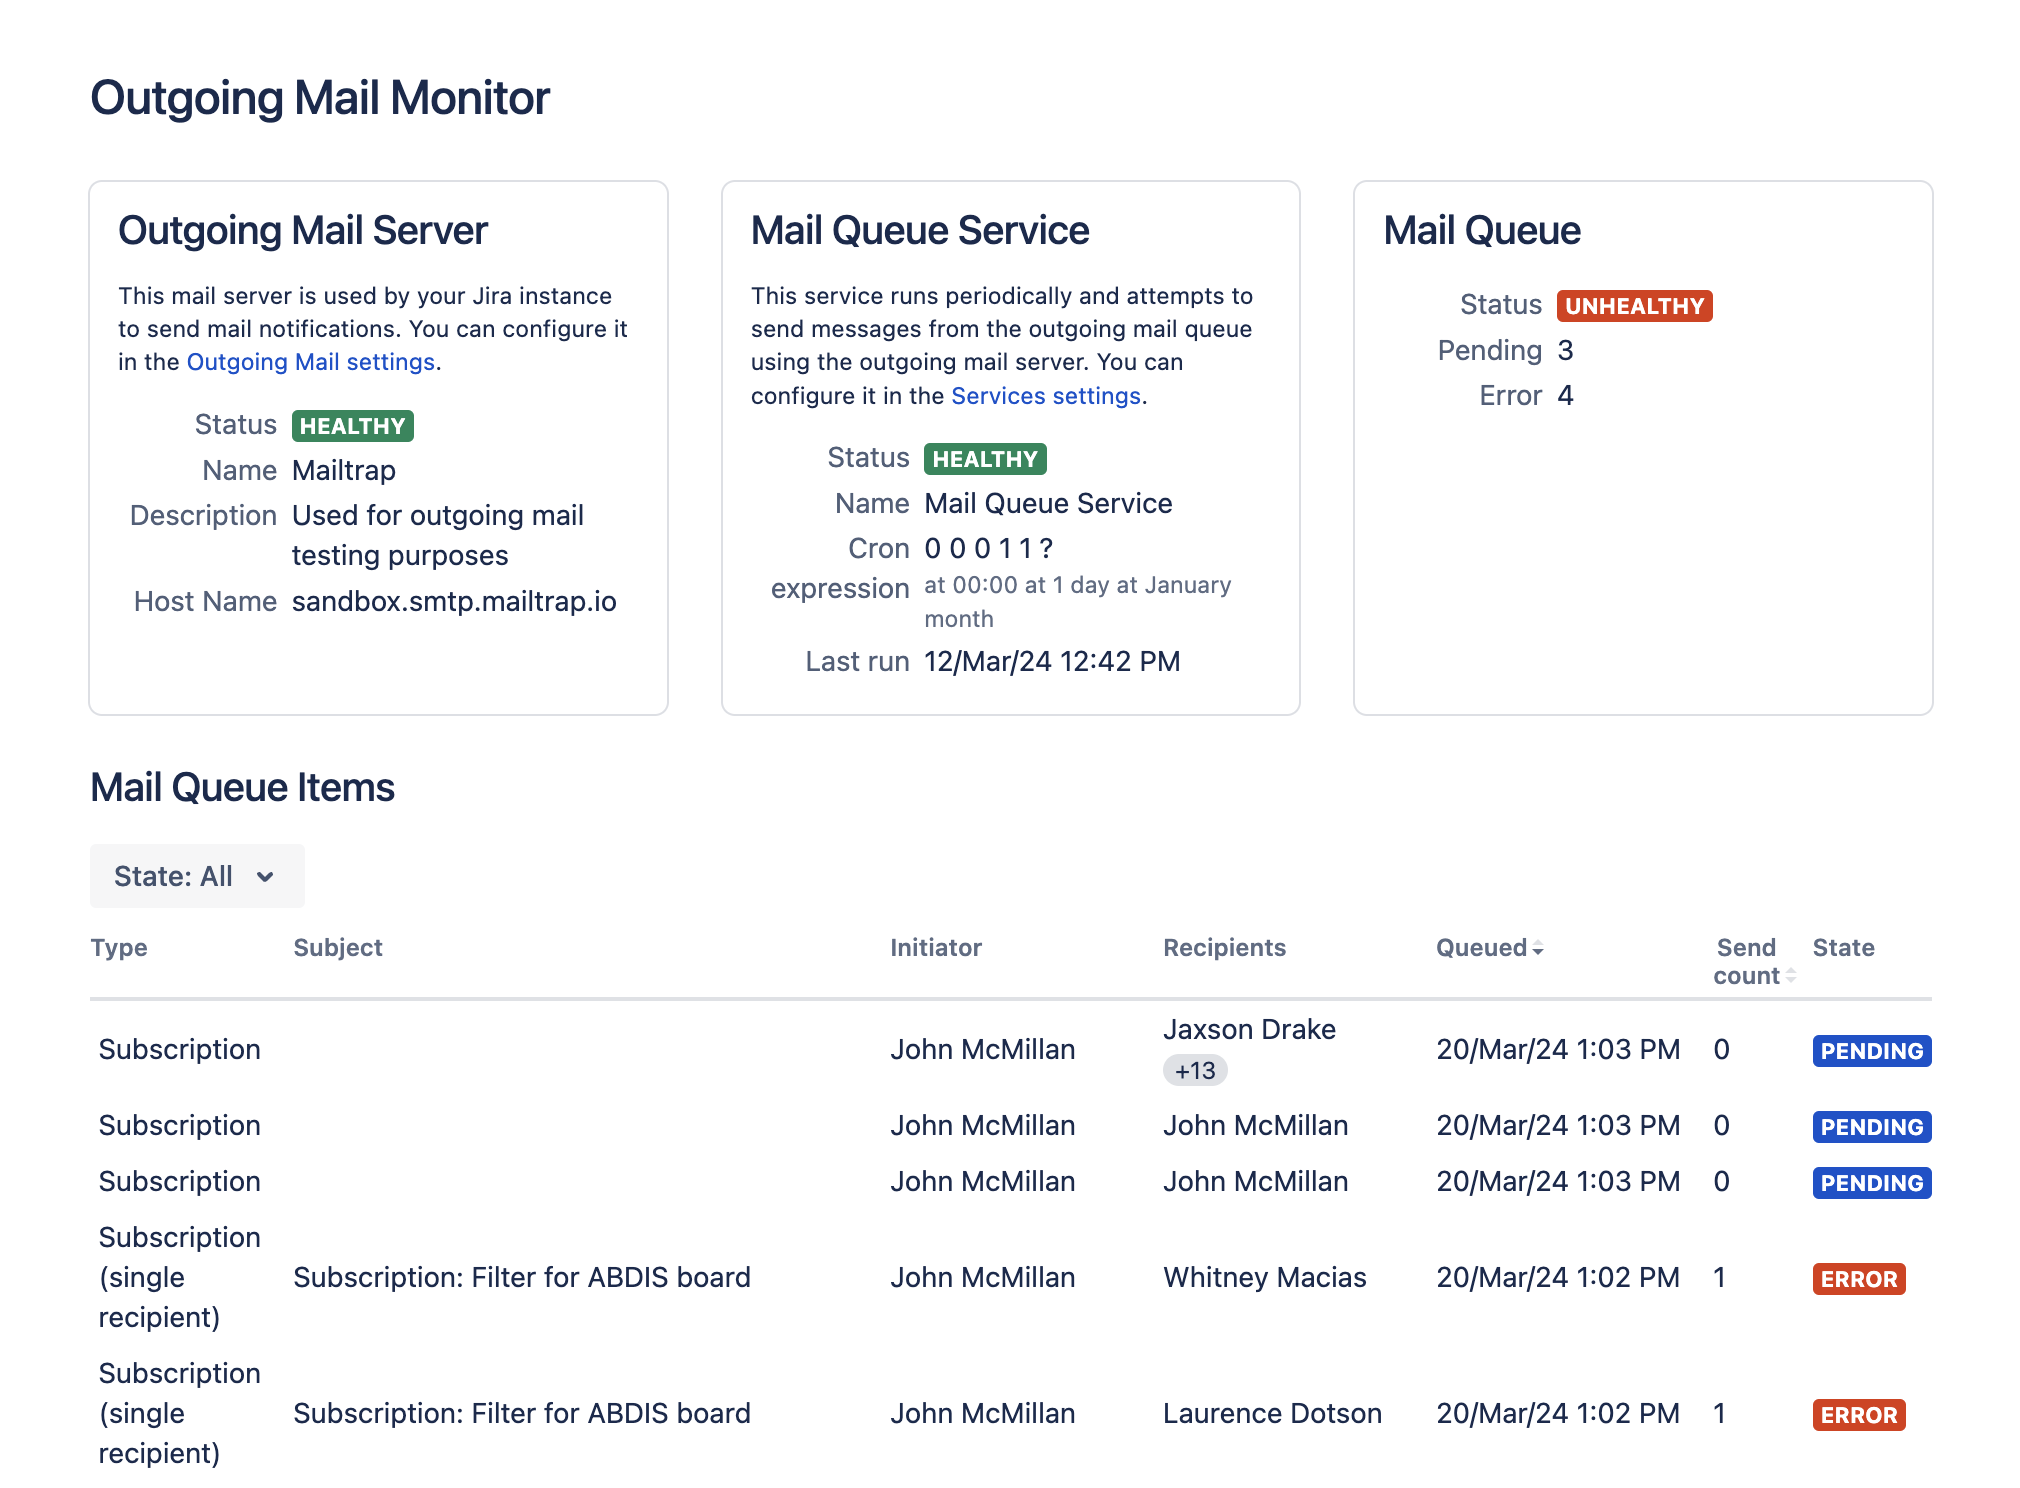
Mail queue monitor on a non-clustered instance:

The page has four sections:
Outgoing Mail Servershows the basic settings and status of the configured outgoing mail server.Mail Queue Serviceshows the basic settings and status of the service.Mail Queueshows the status and statistics of the mail queue.Mail Queue Itemsshows the current mail queue. Extended information is displayed for each element:TypeThe type of mail queue element corresponding to the event that triggered the message to be sent.SubjectSubject of the letter that will be sent. For an element of the “Subscription” type, the subject will be empty, since this element is a collection of letters that will be divided into individual elements when sent.InitiatorThe user whose actions led to this email being sent.RecipientsUsers who will receive this email.QueuedThe date and time this letter entered the queue.Send countThe number of attempts to send this letter.StateThe state of the queue element. Default is “Pending“. If the number of attempts exceeds 10, then this letter goes into “Error“ state.
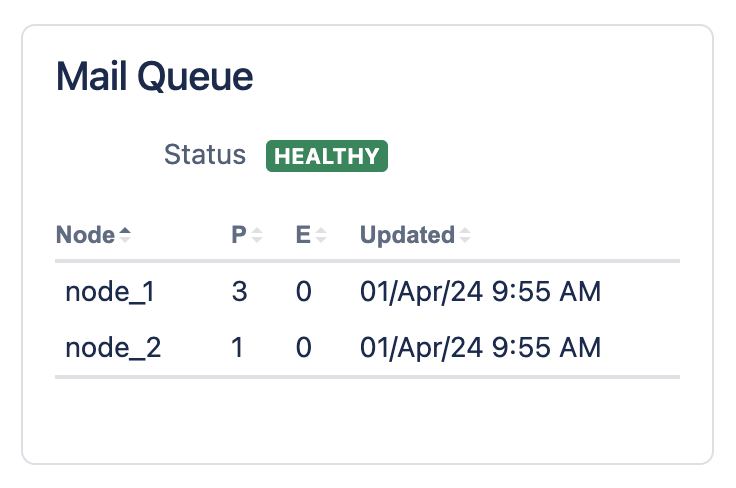
The Mail Queue and Mail Queue Items sections of the monitor operate differently on clustered (multi-node) and
non-clustered instances. In the latter case, queue data is displayed in real time, whereas in clustered instances,
queue data is cached and updated once per minute. The time of the last update is displayed in the Updated column of
the node table.

The value in the Updated column can be “Never”. This means that there is currently no cached queue data, and this can happen immediately after installing/enabling the App or shutting down one of the cluster nodes. Please allow 2-3 minutes for the data to initially load.